December Comedy:
Studies in Senior Comedy and Other Essays
.
To date, we have undertaken four basic validational tests for the Humor Quotient Test
Each test participant was asked to write an essay identifying him- or herself as either closer to the test result or closer to the opposite.
All students were been strongly urged not to consider the feeling of the researchers and to believe that a stand in favor of the opposite identification is just as useful as one favoring the HQT.
Of the 60+ who have been willing to take a stand, that stand has favored the HQT identification better than 7 to 1.
Students were asked to pre-identify their humor personalities through a series of 12 questions about themselves
Students over 30 were better able to anticipate their HQT identification.
Left-brainers tended either to know themselves extremely well or to know themselves close to not at all, assuming the validity of the HQT identifications.
Could even a prototype HQT discriminate humor preferences within a single, extended family?
HQT scores distinguished between families.
To date, we have tested almost 400 participants.
Gotcha is most heavily preferred among student participants.
Male conservatives tend to test Bridgebuilder.
Female liberals tend to test Consoler.
Participants with one or two younger siblings tended to rank high in Crusader.
Women scored higher on Word Play than did men.
A student suggested testing for a correspondence between humor preference and color preference.
The Natural Order Circle illustrates the mathematical relationship between the six humor personalities.
Superimposing the color wheel on the Natural Order Circle, our results indicate a correspondence much higher than random with better than 99.9% confidence.
My background as a humanist suggests haunting confirmations of this correspondence in Western cultural history.
HQT shows promising possibilities for being a fruitful instrument that reveals relationships between politics and humor, between family structure and humor, possibly even between color preference and humor preference.
Chapter 6
Humor Quotient Test: Validation and Results
by Paul and Robin Grawe
Presented at the International Society for Humor Studies Conference
Ithaca, New York 1994
Edited for internet publication
[Ed note: This paper was the second of a two-part presentation on the design and validation of the Humor Quotient Test co-authored by Robin and Paul. The number of participants who have taken the HQT is currently well over 2000, and further study has not brought into question any of the results reported in this paper. Rather these results have been seeds of insight into many fruitful applications within the field of literary criticism.]
As students of language and literature, Robin and I are necessarily indebted to others who are more closely associated with statistical research. So let me acknowledge immediately our indebtedness to Dr. Larry Reuter of WSU’s Biology Department for his recommendations of Siegel and Castellan’s Non-Parametric Statistics for the Behavior Sciences, which provides the mathematical basis for the validation tests mentioned hereafter. I’m also grateful to Dr. Brian Aldrich of WSU’s Sociology Department and to WSU President Darrell Krueger for their methodological insights and direction.
If the methods I am about to describe seem homespun, the naiveté is mine, not theirs. But perhaps some of the naiveté is also an attempt to press validation methods into areas where they have infrequently or never gone, to explore the possibility of literature and language studies becoming less-than-total subjectivity.
1
Four Validational Tests
To date, we have undertaken four basic validational tests for the Humor Quotient Test (HQT). The most recent of these has been to ask participants from Freshman and Advance Composition classes to consider their HQT-determined personality type against its opposite. Thus, someone scoring high in Gotcha and Incongruity, a Crusader, is asked to consider Crusader/Consoler. A participant with high Gotcha and Word Play, an Advocate, is asked to consider Advocate/Reconciler. Each participant is then instructed to write a tightly factual, 500-word essay about him- or herself as the world’s foremost authority. The thesis of the requested essay is to be either that the HQT identification is closer to the truth then its opposite or vice versa.
Students were repeatedly reminded in this experiment that is makes no difference whether they choose the HQT identification or its opposite as long as the choice is their most honest response backed by strong factual evidence.
To date, better than 60 students have been so tested. (Incidentally, this is a wonderful writing assignment because it gives students experience writing factually from a true personal expertise.) Some students, of course, absolutely refuse to get off a fence and answer the question. But of the 60+ who have been willing to take a stand, that stand has favored the HQT identification better than 7-1.
Approximately a third of the essays contain some references to the student’s original skepticism that a bunch of jokes could say anything about personality, followed by some exclamation of amazement that the student has been so perfectly identified by the test. Let me repeat that all students have been strongly urged not to consider the feeling of the researchers and to believe that a stand in favor of the opposite identification is just as useful as one favoring the HQT.
Essays agreeing with the HQT identification are routinely stronger than those disagreeing with the identification in the sense that the agreeing essays have a much more solid and convincing fact base. Those disagreeing tend heavily to rely on general, abstract, non-factual argument, normally centering around the idea that no one test can determine personality. Disagreeing essays also tend heavily to value the writer’s availability to friends, arguing from that that the participant could not a be a Crusader but must be a Consoler, or that the participant could not be an Advocate and must be a Reconciler.
2
Papers agreeing with the identification, contrastingly, tend to base their arguments in central, determinative life choices. Many students from WSU’s Paralegal Program, for example, have been pleased to be rated Advocates by the HQT and base their agreement on their major. As a spectacular example, one of the few males in the test to be identified as a Consoler emphatically concurred with the identification based on his goal to become a funeral director, a career choice encouraged by his home-town funeral director and growing out of his much-remarked-upon natural talent for comforting other family members at his grandfather’s funeral.
Considered mathematically, the basic 7-1 response, if considered as unbiased, measures better than 5.5 standard errors from random (p approximately equal to .00001). Even assuming a Barnum Effect which creates a 70-30 biasing in favor of the HQT identification the hypothesis of validity is upheld at better than 99% confidence. This summer and fall, we are moving to a new level of testing in which participants are asked to identify themselves as one of the six character types before receiving an HQT identification.
A second validational test was conducted by me in a senior literary criticism course and by Robin in a vocational college Freshman English class. A separate questionnaire asked students, before seeing the HQT results, to answer 12 questions about themselves, each question designed to reveal personality types equivalent to the HQT. Participants were then given the HQT, and the results were compared. The hypothesis of the test was that non-traditional, older students—those over 30—would better identify themselves as the HQT did. We tested 32 students, one third of them older than 30, one ninth of the total over 40.
With well over 95% confidence, the older students were better able to anticipate their HQT identification.
A third validational test was conducted with this 32-participant group. Each participant was given a 21-question brain laterality test. Questions include items like, “Would you rather read a map or a series of verbal directions for finding you way the first time?” On this question, using a map is rated a right-brained response, and reading verbal instructions is rated left-brained.
No particular hypothesis was assumed for this test. The question was simply whether the HQT would group left-brainers separately from right-brainers. If it did, it would support the contention that the HQT could be used to make fine discriminations. Could left-brainers be said to know themselves in any sense differently than right-brainers, given the HQT and the self-identification 12-question questionnaire?
3
No simple answer was found. Left-brainers did not “know themselves” better or worse than did right-brainers. However, the scatter of scores revealed a deeper pattern. What we found with considerably more than 95% confidence was that left-brainers tended either to know themselves extremely well or to know themselves close to not at all, assuming the validity of the HQT identifications. Right-brainers, on the other hand, were found concentrated somewhat above average in self-knowledge, assuming HQT validity. In other words, the spectrum could be divided in three with right-brainers concentrated somewhat on the high side of middle while the left-brainers concentrated at the two extremes.
We have worked with and published in laterality areas for several years. In that context, our results seem to us quite defensible. Left-brainers are typically linear and logical in their thought. Give them proper premises, and they tend to come to solid conclusions. Give them poor premises, of course, and their logic may come to conclusions from outer space. But when they find the right logical path, presumably they can be enormously self-analytic.
Contrastingly, right-brainers are global thinkers. As such, they probably find it hard to be totally right about anything. But the inherent checks of a global perspective probably keep them from being totally incorrect as well.
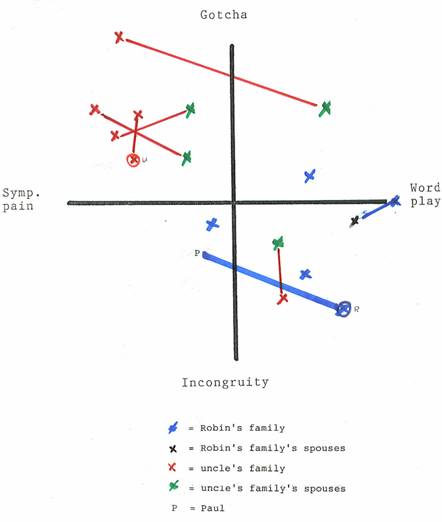
I have saved to last our earliest, and perhaps most homespun validational test. It is perhaps the least scientifically reputable but in a subjective sense the most persuasive to me. This test grew from our attempts to test a prototype HQT to see if our jokes were well-matched. As guinea pigs for this testing, we enlisted relatives. This quickly led to a thought—could even a prototype HQT discriminate humor preferences within a single, extended family?
An immediate hypothesis was that Robin’s relatives (her mother, her brother, her sister-in-law, her children) would be different from my uncle’s family (my uncle, his wife, their children, their children’s spouses). I was subjectively sure that such a difference existed. It has always seemed to me that my uncle and his family have been heavily influenced by my grandfather’s strongly Gotcha-centered sense of humor. Today, even with a hiatus of 35 years, this impression of my grandfather remains strongly with me. I suspect anyone who knew him was similarly impressed. Robin’s family, on the other hand, never actively displays a Gotcha humor, and I find this very refreshing, being something of a refugee from my own family’s practical jokes and the like. For myself, I had to assume that I would fall somewhere between the two groups—I am after all my grandfather’s grandson and at the same time the father of Robin’s children.
4
One version of the results is shown in Figure 1. My uncle’s family is in red connected by red lines to spouses in green. Robin’s family is in blue connected by blue lines to spouses in black. Paul is "P." A fairly complex mathematics establishes a high-confidence result, but the graphic is the strongest evidence of the HQT’s ability to analyze difference in humor within an extended family.
Humor Preferences within an Extended Family
Figure 1
5
In short, then, our validation tests have shown: 1) that participants agree with their HQT results, 2) that older participants identify themselves more closely to the HQT identification, 3) that left- and right-brainers know themselves differently based on HQT identification, and 4) that HQT can identify subjectively perceived differences in humor within an extended family group.
HQT Investigative Results
To date, we have tested almost 400 participants. Many of these are too recent for inclusion in the present summary. Results here are for participants tested by March 1, 1994, a total of 260 respondents.
Calibrational results for the revised HQT include the following: the average Gotcha score was 12.25; the average Sympathetic Pain was 10.08; the average Incongruity was 10.26; the average Word Play was 9.38. We know from preliminary analysis of later results that Sympathetic Pain did much better with a retiree church group, at the expense of Gotcha and Incongruity. It is perhaps interesting to note, despite our attempt to make equally funny jokes, that Gotcha is the generally preferred and also the most thoroughly analyzed in the criticism of Meredith, Bergson, Freud and the like. Word Play has a reputation for being the lowest form of humor and scored on average lowest, despite our attempts to choose equally funny pairs of jokes.
The sigmas for these four samples are all between 2.21 and 2.38. In other words, all four closely approximate the expected random sigma around the mean. The maximum number of Gotcha choices by an individual was 18. The maximum of the three other categories was 16. The minimum Gotcha preference was 7; Incongruity was 5; Sympathetic Pain and Word Play were both 4.
These calibrational basics aside, our early experimentation has allowed us to come to a number of statistically strong conclusions which, to our knowledge, have not been previously discussed. An example is the interrelationship between gender, political preference, and humor. Male conservatives (by their own definitions of conservative) are disproportionately among the top sixth in Bridgebuilder rank. Using the proportionality test (in which the standard error of estimate is the square root of pq(1/n1 + 1/n2) this disproportion measured above the 98% confidence level. Female liberals (by their own definitions of liberal) were disproportionately Consolers. This disproportion indicated a 99.6% confidence level.
6
Another interesting area of investigation has been the relationship of humor to place in family. I want to write more extensively on this, but a few results will give some sense of the findings. For Crusader personalities, participants from families with one or two younger siblings were more likely to be high ranking (p<.0005), measured by a Wilcoxon-Mann-Whitney ranks test. It thus seems that the family plays a central role in the development of humor preferences, and especially that growing up with younger siblings in a family of about four children provides the most fertile soil for Crusader development. I suspect strongly that the child’s ability to interact with and to be to some extent responsible for younger children is important in accounting for these results.
The political and family position results are fairly complex and deserve much more extended treatment. They are presented here only as examples of the fruitfulness of research using the HQT.
In many ways a simpler result is that women respondents scored significantly higher on Word Play than did men. Thus, ceteris paribus, women should find it more difficult than men to be identified as Crusaders, Bridgebuilders, and Reconcilers, but more easy than men to be identified as Advocates, Consolers, and Intellectuals. We noted above that female liberals score disproportionately high numbers of relative Consolers, that is the top sixth in Consoler rank. Conservative females score disproportionately high numbers of relative Intellectuals.
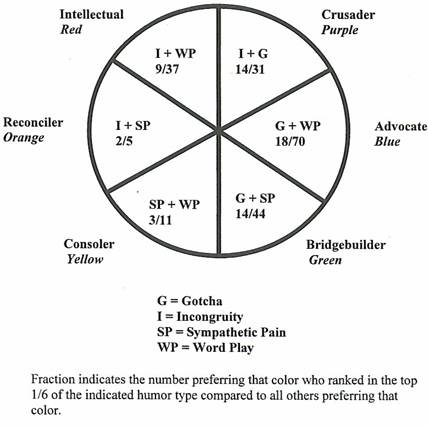
The most complex results we have found consider the possible relationship between humor quotient and color preference. This remarkable idea was well beyond our imaginations, but was suggested in one of my literary criticism classes by a student, Carol Borzyskowski, of the Winona public library. While the thought is highly imaginative, it does have suggestive precedents in late-19th century French poetry’s associational poets Rimbaud and Baudelaire.
In any case, we added color preference to our sociological questionnaire, and we had, as of March 1, 213 participants who had indicated color preference on a color wheel from purple to red (thus excluding responses of black, white, and grey).
It is possible to establish various circles or the humor results as well. I prefer what I call the Natural Order Circle, a configuration which illustrates in one way the mathematical relationship between the six humor personalities. On this circle, the three personalities that share a strong Gotcha score are grouped together, as are the three Incongruity and three Sympathetic Pain personalities. In each group of three, the personality type which is also strong on Word Play is in the center. Since Word Play, according to our theory, indicates a preference for decorum, fittingness, and the like, centering the Word Play personality centers the “fitting” version of the other preference. This configuration forms a circle. With an arbitrary starting point, we could call this the Crusader, Advocate, Bridgebuilder, Consoler, Reconciler, Intellectual Configuration as well.
7
Could there possibly be a correspondence between the color wheel and this humor preference circle?
Superimposing the color wheel on the Natural Order Circle, lining up purple with Crusader, blue with Advocate, and so forth through red with Intellectual, our results indicate with better than 99.9% confidence just such a disproportional correspondence. (See Figure 2.) We find even higher confidence results if we assume that people’s color preference may be one color off clockwise or counterclockwise.
Natural Order Circle with Color Correspondences
Figure 2
8
Without belaboring the point, I hope to write on this separately. But my background as a humanist suggests haunting confirmations of this correspondence in Western cultural history. For example, if Crusader is taken as most correspondent to those entrusted with authority and justice—kings and emperors—purple has been associated with such offices since before Rome. If Crusader is the hero-type, its color is reflected in the Purple Heart Decoration.
Sky blue is the color always ascribed to the Virgin Mary in Catholic iconography, and in the same theology she is termed “Mediatrix,” the female mediator. The kings’ advocates throughout the Middle Ages were his “companions,” the counts, viscounts, and barons, who we colloquially refer to as “blue-bloods.”
Green as the color of the natural world has been for centuries variously described with Nature as the bridge between surface and deeper self, between God and Man, between humanity and the inorganic Creation.
Yellow, which in our system corresponds to Consoler, is the color of the smiley face. In recent clinical research, it is also the color of pain, recovering convalescents often choosing less and less yellow in their creative therapy as their condition improves and pain decreases.
Orange, at least in its brown form, is the color of earth and thus has been traditionally associated with our need to reconcile ourselves and our affairs to our mortality.
Red throughout the modern period, has been the color of the far left, especially of Communism. The assertion of that left has characteristically been that Marx provided the intellectual basis for a new world order.
This paper is no place to undertake a humanistic dissertation on the association of color. We present our results here only as one of the deeper statistical mysteries we are currently probing with the HQT.
9
As stated throughout these papers, we consider ourselves primarily humanists rather than scientists, and within the humanist tradition, we believe with many thinkers that we need empirical results to keep us from much unfruitful speculations. As a humanist, I remember back to my high school science classes in which we were repeatedly reminded that one of the fundamental tests of science is fruitfulness. If a theory or an instrument does not produce fruitful results, I was told, science must necessarily remain highly skeptical of the theory or instrument. I have tried to show above that the HQT shows promising possibilities for being a fruitful instrument that reveals relationships between politics and humor, between family structure and humor, possibly even between color preference and humor preference.
We appreciate the opportunity to present this research here at Ithaca before behavioral scientists. We would be glad for any suggestions you might make for tightening up our investigations. And we also invite any of you to use the HQT in your own research.
10
Works Cited
Siegel, Sidney and N. John Castellan. Non-Parametric Statistics for the Behavior Sciences. USA: McGraw-Hill, Inc., 1988.
Next DC Chapter DC Contents DC Cover ITCHS Home